Uncertainty-Aware Reliable Text Classification
A text classifier can be uncertain because an input is hard to decide or because the input is not the kind of text it learned, and a single confidence score treats these two cases as one.
| 1 | “This was the worst restaurant I have ever had the misfortune of eating at.” | A clear negative review: strong evidence, all for one label. |
| 2 | “This restaurant is bad. Yet its food is acceptable considering the low price.” | A mixed review: evidence for both labels. |
| 3 | “Deep learning is data hungry.” | Not a review at all: almost no evidence for either label. |
The paper starts from three sentences that a classifier trained to sort restaurant reviews into positive and negative might receive. A standard classifier can call sentence 3 a positive review with high confidence, because it must choose one of the labels it knows. Even a well-calibrated classifier gives sentences 2 and 3 the same output, an even split between positive and negative. Its probabilities say it is unsure in both cases, but not why.
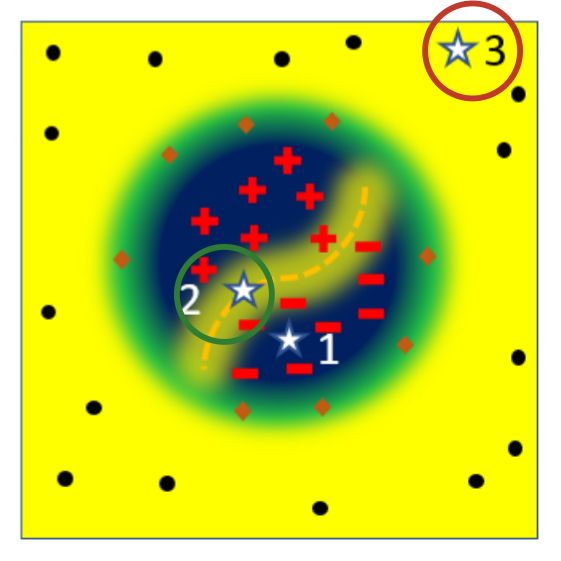
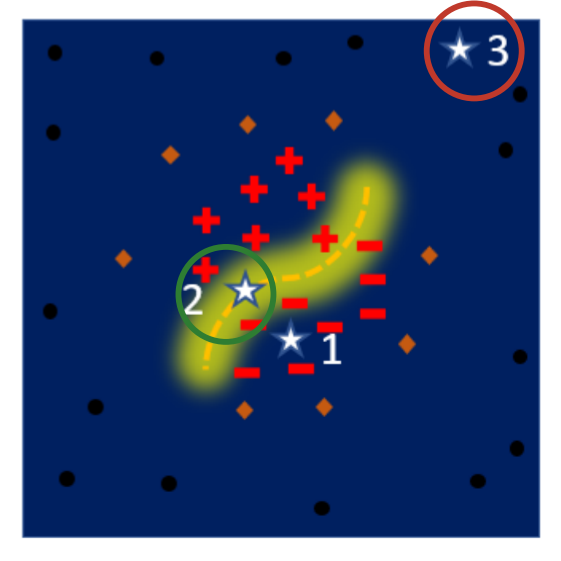
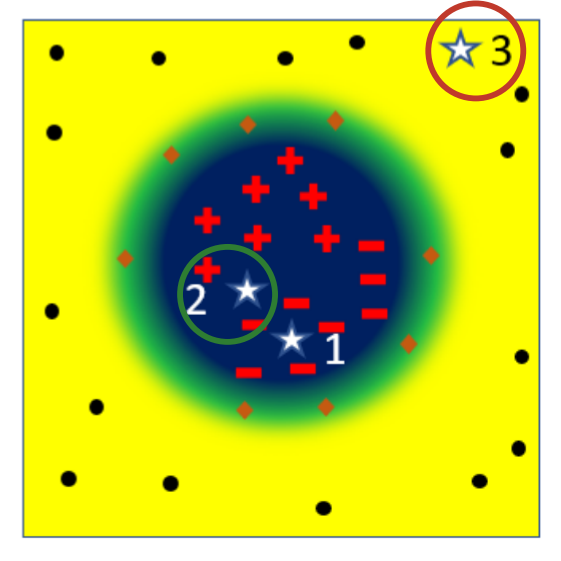
In the maps, red plus and minus signs are positive and negative training reviews, black dots are unrelated text, and orange diamonds are synthetic training inputs of the kind described below. In the first panel, the usual single score (the entropy of the predicted probabilities) puts both circled sentences in yellow. The other two panels split that uncertainty by its cause, using measures from subjective logic. Dissonance, which is high when the evidence supports both labels, lights up only along the border between positive and negative reviews, where sentence 2 sits. Vacuity, which is high when there is little evidence of any kind, lights up only far from the training reviews, where sentence 3 sits.
To estimate vacuity, the classifier outputs an amount of evidence for each label instead of a probability (an evidential neural network). During training it also sees unrelated text, sentences from Wikipedia articles, and synthetic inputs. Each synthetic input is a training review whose internal representation has been shifted a fixed distance in the direction that most increases the classifier’s error, which places it just outside the region real reviews occupy. The classifier is trained to report high vacuity on both.
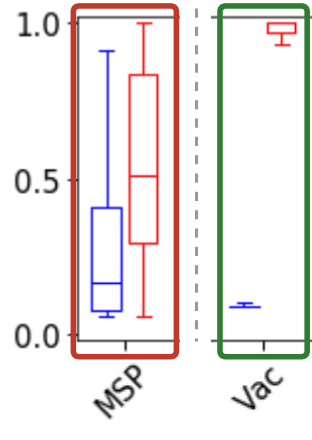
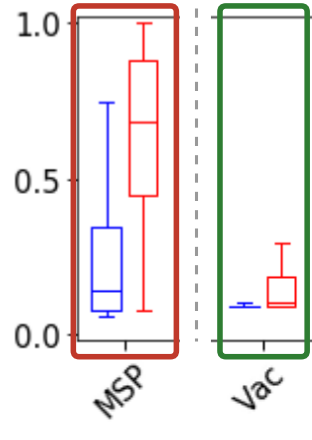
For the standard classifier (left pair), the reviews it got wrong look as uncertain as text from other datasets, or more so. Vacuity (right pair) keeps them apart: it stays low on misclassified reviews and is close to its maximum on the other text. The reviews come from the SST movie-review dataset, and the two pairs come from different models, so the misclassified reviews are not the same set. The difference shows when the scores are used to flag unfamiliar input. When each method was set to catch 90% of the text from other datasets, standard confidence also flagged 57.18% of normal movie reviews, the best earlier method (Outlier Exposure) 39.89%, and ours 23.34%, averaged over five other text datasets. The average hides one exception: on WMT16, a set of news sentences, ours did worse than every baseline.
The three sentences and the maps above are illustrations; the box plots and percentages are measurements. The experiments cover English text classification with a two-layer GRU and with BERT, and the unfamiliar inputs are other public text datasets.